SEOKit · Observed on
September Google spam update: which pages lost search clicks?
Search Console clicks fell from 29,722 to 25,220 after the September 2026 spam update. Compare two complete 14-day windows and see why five pages worth reviewing lost 1,456 clicks.
How we checked the September 2026 spam update

Four steps from the SEOKit monitor. The recording shows aggregate clicks and page counts for one anonymized property.
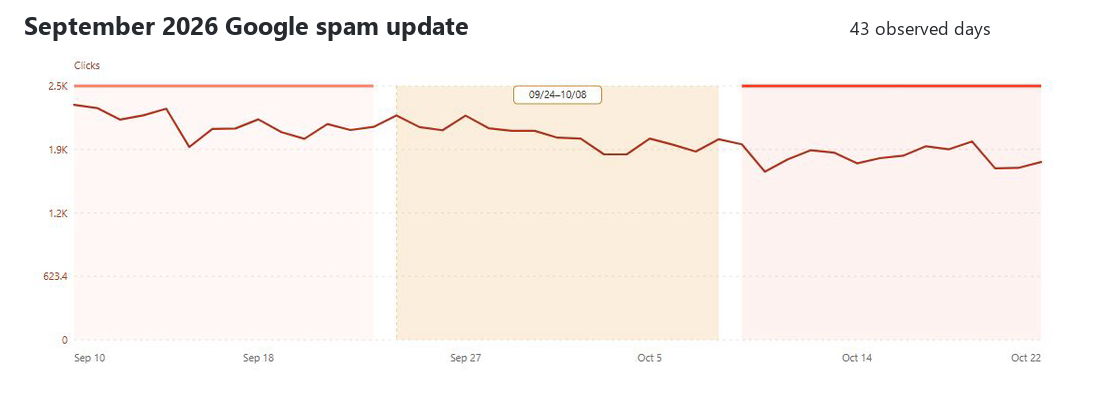
Google spam update impact on daily clicks
Did the decline continue after the rollout finished? Average daily clicks dropped from 2,123 before the update to 2,004 during it and 1,801 after it. We then checked how many pages lost clicks and which ones warranted a closer look.
Official Google rollout dates ↗
How to monitor an ongoing Google core update: the November example
How to compare clicks before and after a Google algorithm update
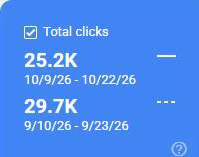
We used Web Search on all devices. Each window includes 14 complete days and two of every weekday. The 15 rollout dates stay visible on the chart and are excluded from the change calculation.
Google Search Console
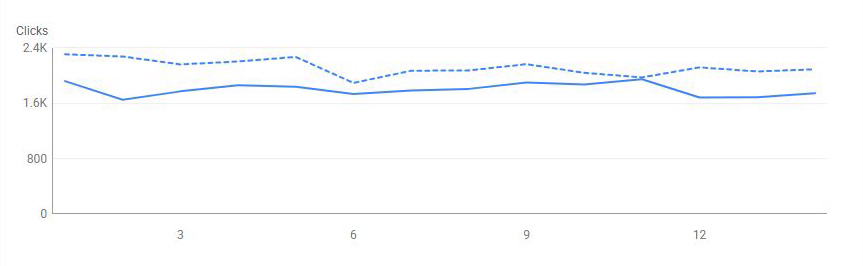
| Period, 2026 | Clicks |
|---|---|
| Before · Sep 10–23 | 29 722 |
| Rollout · Sep 24–Oct 8 | 30 065 |
| After · Oct 9–22 | 25 220 |
SEOKit · Google Updates Monitor
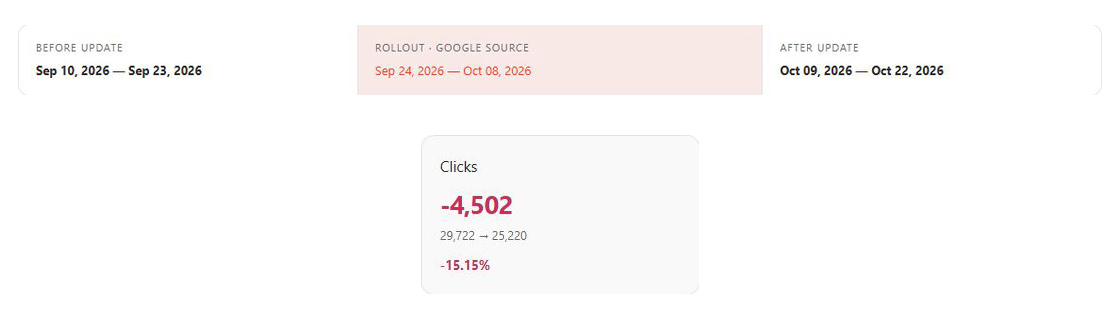
25 220 − 29 722 = −4 502. That is a 15.15% decline for the property. The page lists below show who contributed gains or losses.
Pages losing traffic after a Google update: where to start
The monitor flagged 95 pages losing at least 10 clicks and 28 gaining at least 10. To qualify, a URL had to appear in both windows and reach 20 clicks in at least one. New, missing and low-volume pages are separate, so these groups do not sum to the site total.

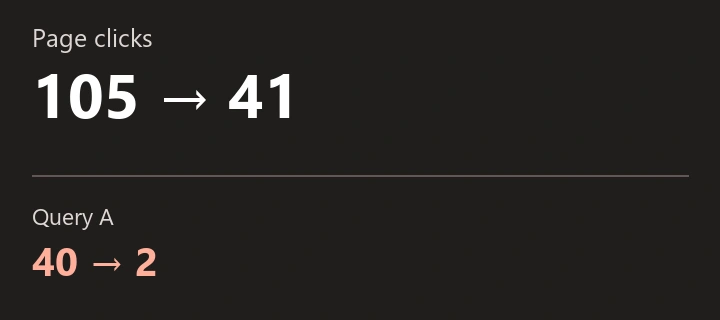
Our next check. Start with those five losing URLs. In GSC, filter to each page and compare its queries across the same dates. Check whether impressions fell or similar exposure produced fewer clicks. A site-wide rewrite would also affect pages that gained traffic. Timing alone cannot establish why a page moved.
What SEOKit makes faster than manual GSC comparison
In Google Search Console, compare date ranges in Performance, open Pages and sort the click differences. To reproduce this shortlist, check the minimum volume, keep pages present in both periods and add up the first five losses. You also need the official rollout dates.
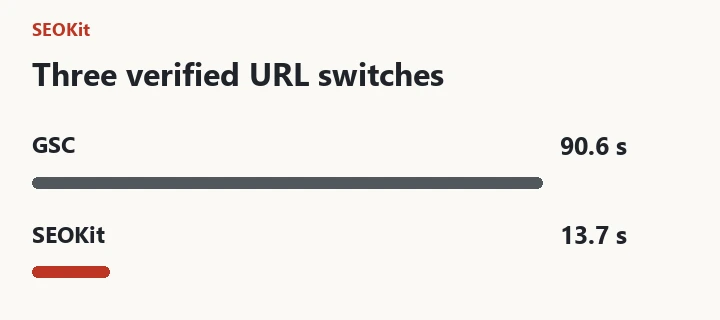
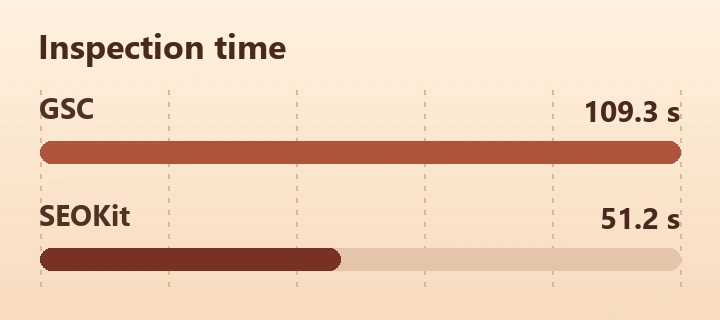
In SEOKit one comparison showed both the 4,502-click decline and the first five pages to investigate. Those pages lost 1,456 clicks combined, while 28 other qualifying pages gained traffic. Sorting the lists and adding the top losses required no export. We compared the steps without timing either workflow.