SEOKit · Observed on
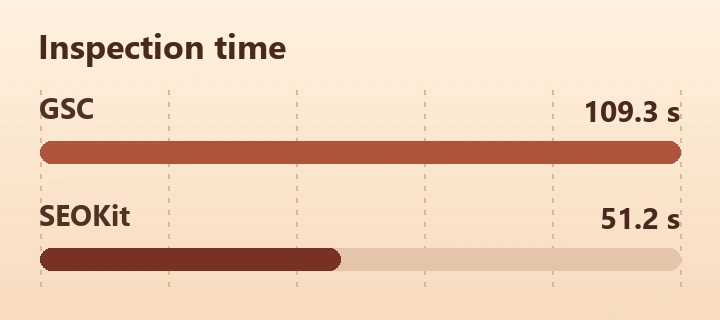
Finding keyword cannibalization: 90.6 s in GSC, 13.7 s in SEOKit
Nine queries lost clicks at similar impressions. For three of them, another landing page took the lead. In one browser run, SEOKit found all three pairs without a list of queries or URLs.
Finding and checking all three URL pairs
| Tool | Reports checked | Time incl. loading |
|---|---|---|
| Google Search Console | 9 individual Pages reports | 90.6 s |
| SEOKit | 1 report with all 3 pairs | 13.7 s |
One SEOKit report replaced nine GSC Pages reports and saved 76.9 seconds in this run. One automated browser run per tool, already signed in with dates selected. The query names and URLs were unknown to both workflows. Both timers included loading and checking the three pairs.
Which pages to inspect first
For each query, “Page A” had more impressions in the first period and “Page B” had more in the second. Select a query to see clicks and impressions for both pages.
- Query 2 — start with the filter on “Page B”. Check which power rating buyers need and where links for that rating take them. If the wrong filter opens, correct the link or the label and then track site clicks for the query.
- Query 3 — compare the product listing (“Page A”) with the article (“Page B”). If searchers want advice, keep the article and give readers a clear route from it to the relevant products. If they want to shop, investigate the listing’s position and CTR first.
- Query 1 — keep both pages for now. “Page B” led by only 14 impressions, and “Page A” still drew 573 clicks. Review “Page A” by country and device before considering a redirect.
The measured saving was in finding and checking the pairs. A follow-up GSC comparison after an edit would show whether total clicks for the query recovered.
Watch the walkthrough · Repeat the check · How SEOKit saved time
Query 2: which product filter to check first
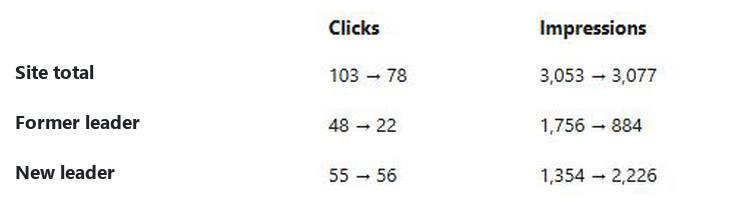
Check “Page B” first. “Page A” filters by rated power and “Page B” by maximum power, judging by the landing-page addresses. “Page B” gained 872 impressions and just one click. “Page A” lost 872 impressions and 26 clicks. Across the site, impressions rose from 3,053 to 3,077 while clicks fell from 103 to 78.
Compare 14 Sep–15 Dec 2025 with 16 Dec 2025–18 Mar 2026. The screenshots show cells from the same query in each tool. “Page A” and “Page B” identify the same two pages in both screenshots.
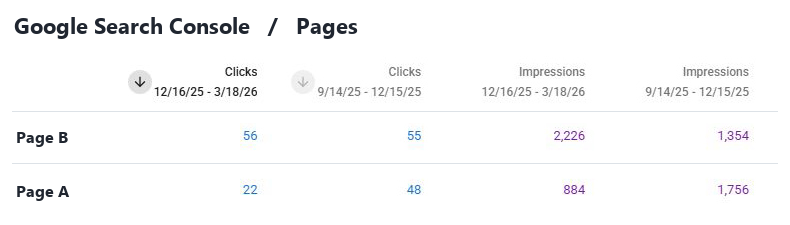
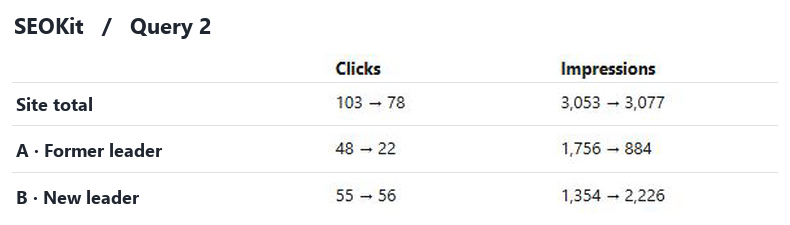
| Metric | “Page A” | “Page B” |
|---|---|---|
| Impressions before | 1756 | 1354 |
| Impressions after | 884 | 2226 |
| Clicks before | 48 | 55 |
| Clicks after | 22 | 56 |
Check what power rating the query implies, which products “Page B” includes, and which rating its title and H1 promise. If the buyer expects rated power, check whether internal links for that attribute lead to “Page A”. The report identifies the page to inspect; the decision to change the filter depends on what the catalogue actually offers.
How many clicks the site lost for each query
Each row is one query. Both tools returned the same site totals.
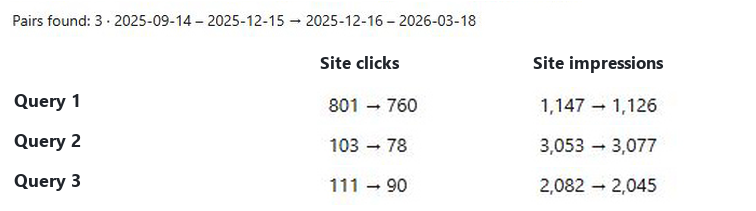
| Query | Clicks before | Clicks after | Change |
|---|---|---|---|
| Query 1 | 801 | 760 | −41 |
| Query 2 | 103 | 78 | −25 |
| Query 3 | 111 | 90 | −21 |
Which page led before and after
Before: 14 Sep–15 Dec 2025. After: 16 Dec 2025–18 Mar 2026. For each query, “Page A” and “Page B” are two pages on the same site. Bold marks the page with more impressions in each period. Both pages continued to appear in Google.
Query 1
| Metric | “Page A” | “Page B” |
|---|---|---|
| Impressions before | 1130 | 1115 |
| Impressions after | 1082 | 1096 |
| Clicks before | 649 | 143 |
| Clicks after | 573 | 151 |
Check “Page A” first. Both pages lost impressions. “Page B” finished just 14 impressions ahead of “Page A”. “Page A” still earned 573 clicks but lost 76, while “Page B” gained only 8. In GSC, compare CTR and average position for “Page A” for this query by device before deciding whether to change either page.
Query 3
| Metric | “Page A” | “Page B” |
|---|---|---|
| Impressions before | 1983 | 825 |
| Impressions after | 1831 | 1933 |
| Clicks before | 99 | 12 |
| Clicks after | 47 | 49 |
Check “Page A” first. “Page B” overtook “Page A” in both impressions and clicks. “Page B” gained 37 clicks, but “Page A” lost 52 while still receiving 1,831 impressions. Filter GSC to “Page A” and this query and check where its CTR fell. The two pages together lost 15 clicks. GSC recorded a loss of 21 for the whole site.
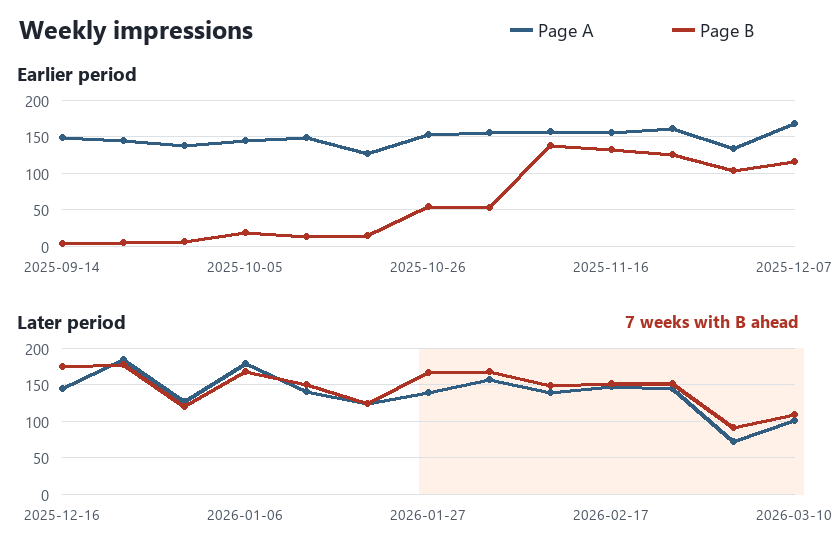
“Page B” led on impressions for seven consecutive weeks
“Page A” led in each of the first period’s 13 full weeks. In the later period “Page B” led for seven consecutive weeks, from 27 January through 16 March 2026. “Page A” is a product listing and “Page B” is an article, based on their addresses. Check whether the results for this query favour shopping or advice before changing the listing.
GIF walkthrough: finding the three pairs

The recording skips part of the wait. The timer included the full load.
How to check your own URL pairs
1. Open the report for your site
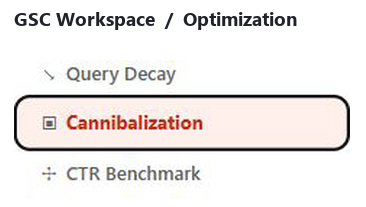
Select your Search Console property in GSC Workspace. In the sidebar, open Optimization → Cannibalization. Look for the “URL switches with lost clicks” section. Open the tool →
2. Set the later date range
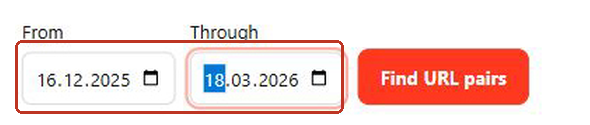
We entered 16 Dec 2025 through 18 Mar 2026. SEOKit compared those 93 days with the preceding 93 days, 14 Sep through 15 Dec 2025. For your site, select the period whose loss you want to investigate.
3. Run the search for URL pairs
The button starts the search across queries for the selected site. Leave the tool to compare the pages for you. The status beneath the dates shows when it is working.
4. Read the match count and pick a query
The status line gives the count and both date ranges. The cards below it are sorted by site clicks lost. We found three pairs. Follow query 2, where site clicks fell from 103 to 78 even as impressions rose.
5. Compare both page rows
Read each arrow from the earlier period to the later one. In query 2, the former leader went from 1,756 to 884 impressions. The new leader went from 1,354 to 2,226, yet gained just one click. Check “Page B” first. Compare its search snippet and content with what the searcher asked for.
How we timed the search
We chose two 93-day periods with multiple switches: 14 Sep–15 Dec 2025 and 16 Dec 2025–18 Mar 2026. Each tool had one automated browser run from a blank tab, signed in with dates preset. No query or URL was entered. We stopped the timer after reading the clicks and impressions for all three pairs.
GSC showed 500 queries sorted by recent clicks. We checked the 300 with at least 30 recent clicks for a loss of at least 20 clicks, at least 1,000 earlier impressions and an impression change within ±5%. Nine passed. For those nine we compared the pages with the most impressions before and after.
Why SEOKit found the same three URL pairs faster than GSC
Finding and checking all three pairs took 13.7 seconds in SEOKit and 90.6 seconds in GSC. That saved 76.9 seconds, about 85% of the time, in one automated browser run per tool. Both timings include loading the report.
Where the time went in GSC. We started without a list of queries. Nine queries lost clicks while their impressions held roughly steady. For each one we opened Pages and compared the two periods to see which URL had the most impressions. Only three of the nine showed the switch we were looking for.
What one SEOKit report gives you. SEOKit runs that check across queries using the same GSC data. It lists the matching pairs by clicks lost for the site and puts both URLs’ clicks and impressions side by side. For query 2, the filter on “Page B” gained 872 impressions but just one click, while the filter on “Page A” lost 26 clicks. That makes “Page B” the first page to inspect.