 Written by
Alexander Yarovenko
 Edited by
Margarita Yarovenko
The November 2026 Google core update started on November 10 and was still active when we checked on November 20. We selected it in the SEOKit monitor to see what an analyst could tell a site owner that day. The last point in our Search Console chart was November 17. That gives us eight calendar dates of observations during rollout and no observations from a completed post-update period. Google’s November incident record.
Google’s November core update began on November 10
Google recorded the start at 10:06 a.m. Pacific time. Its announcement applies to ranking globally and across languages. Google initially estimated that rollout could take up to two weeks. The date that matters for a comparison is the actual completion date recorded by Google. Adding the estimated duration to the start date gives you a reminder to check the status, but it cannot establish the boundary of an after period. Official Google update history for this event.
Keep three dates in your notes. November 10 is the start of the ranking event. November 17 is the last date visible in this particular traffic series. November 20 is the date of our status check. A colleague who receives a chart on a Friday may reasonably assume that Thursday’s traffic is included. Recording the observation cutoff alongside the event date makes it possible to check that assumption without knowing anything about the client or having access to its account.
Search ranking changes during a core update
November is the third broad core update to Google Web Search in 2026. The earlier ones began on March 27 and May 21. The shaded September event on our chart was a separate spam update. If a page began losing rankings in September, check the two events individually before assigning the decline to November. Google’s ranking update history.
A core update changes how Google weighs competing results for a query. A page can move down when another result serves the searcher better, even if its owner has made no edits. Google confirmed a worldwide rollout across languages. Its November announcement did not identify a target industry or disclose a new ranking factor. How Google describes core updates.
Early ranking shifts across UK and US search results
SISTRIX saw movement in its US and UK data from November 13, three days after launch. On Saturday, November 14, Barry Schwartz at Search Engine Roundtable saw more volatility across several trackers. These are observations during rollout. For the SEOKit comparison, November 9 remains the last day of the baseline. Search Engine Roundtable’s tracker review.
Two education sites moved in opposite directions. Between November 13 and 20, MyMaths rose from 0.49 to 1.17 on the SISTRIX UK Visibility Index, while Virtual College fell from 2.55 to 1.40. Those are visibility scores for tracked UK rankings. Actual search visits would require each site’s own data. In its November 19 sector analysis of 7,500 UK domains, SISTRIX found no clear sector-wide loss. SISTRIX domain and sector analysis.
The Guardian illustrates the risk of picking the wrong starting date. It appeared to have lost visibility since launch. Looking further back, SISTRIX found the downward trend was already underway. Apply that check to our chart: if clicks were already slipping to the left of November 10, establish when the decline began before attributing it to this update. SISTRIX’s November 20 review of The Guardian.
The rollout marker on the search traffic chart
Open the Google updates monitor in SEOKit, choose the connected Search Console property and select clicks. Start with a range that includes several weeks before November 10. Read the daily click line from the left toward the vertical boundary labeled 11/10 in the English interface. The red shading to its right begins on the official launch date. The earlier shaded area on this chart belongs to a different event.
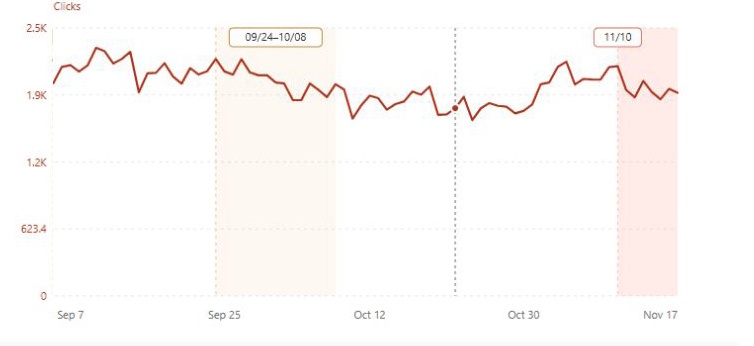
Notice the peaks and dips to the left of the November boundary. Daily clicks were already moving before the launch. Now look at the right edge. It tells you where the available reporting range ends. It does not supply an end date for the ranking update. When sharing a chart internally, leave the metric name, the start marker and the final date visible. You can remove the project name and all page addresses without losing the evidence needed for this first decision.
Date ranges for comparing clicks in Search Console
The baseline for a seven-day window is already fixed. It runs from November 3 to November 9 inclusive. A fourteen-day baseline would start on October 27 and end on the same November 9. The first complete week after rollout cannot yet be dated. Google recommends waiting at least a full week after a core update finishes before analyzing its effect in Search Console. Google Search Central guidance on core updates.
| Reporting window | Dates in our observation | What can be measured |
|---|---|---|
| Before launch | November 3–9 | Baseline for a seven-day comparison |
| During rollout | November 10–17 on the chart | Daily movement on eight observed dates |
| After completion | End date still pending | The full following week is unavailable |
There is an easy trap here. November 3–9 and November 10–16 are both complete weeks with the same mix of weekdays. A spreadsheet will happily calculate the difference. That result answers a legitimate question about the first week of rollout. Label it accordingly. Calling it an after-update change would put every day in the second sample in the wrong phase. We leave the final row without a click total so that the next person reading the table cannot mistake it for a measured zero.
An ongoing rollout in the SEOKit report
Below the chart we selected the November event and a seven-day comparison window. The monitor displayed the start, kept the comparison button unavailable and explained what was missing. Two earlier spam updates on the same screen have both boundaries. Check the selected event before reading an existing comparison, especially when several shaded bands appear in the traffic range you have chosen.
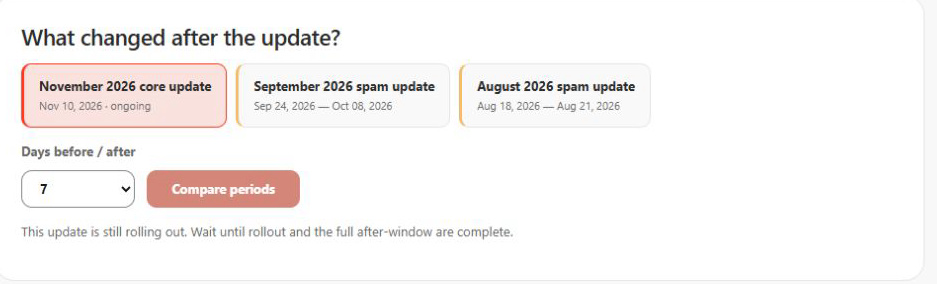
This saves a particular piece of manual work. In GSC you can select the dates and read the clicks, but you must establish the rollout boundaries separately and check whether your supposed after period is complete. In the monitor the chart and that decision sit together. A completed example is our September spam update case. It shows how the same workflow produces a list of pages to investigate when both windows are available. Its counts belong to September.
Page and query checks when organic traffic drops
Record the property, search type, country, device and last observed date before changing any filter. In the Performance report open Pages to see whether the decline is concentrated on a few landing pages. For each candidate open Queries with the same dates and filters. If impressions fell along with clicks, identify the queries on which the page appeared less often. If impressions stayed close, compare click-through rate and position on the same queries. Google’s definitions for the Performance report.
Check your own change calendar alongside the Google timeline. A section migration or a broken redirect deserves investigation during an update too. Test one old address and its final destination with the redirect checker if that matches the symptom. For a loss concentrated on one page, our organic traffic drop case shows how to narrow the investigation to particular queries. A timed coincidence on the chart cannot tell you which explanation applies. Google’s search traffic debugging guide.