SEOKit · Observed on
Google Search clicks dropped. What should you check?
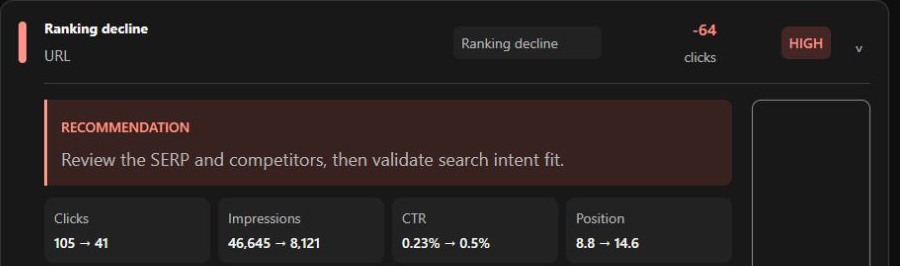
A page fell from 105 to 41 Google clicks. SEO Analyst compared 595 queries. Three lost 38, 16 and 10 clicks. We checked the figures in Search Console.
From a 64-click drop to the first query to inspect

Four steps using the saved analysis and the matching Google report. Page and query names are anonymized.
How to investigate an organic traffic drop for one page in Search Console
We compared 13 July–9 August with 10 August–6 September 2026: two consecutive 28-day periods. Both reports use the exact page in Google Web Search, across countries and devices. Google displays the later period first. The table reads from earlier to later.
| Page metric | GSC | SEO Analyst |
|---|---|---|
| Clicks | 105 → 41 | 105 → 41 |
| Impressions | 46.6K → 8.12K | 46 645 → 8 121 |
| CTR | 0.2% → 0.5% | 0.23% → 0.50% |
| Average position | 8.8 → 14.6 | 8.8 → 14.6 |

Which search queries lost the most clicks?
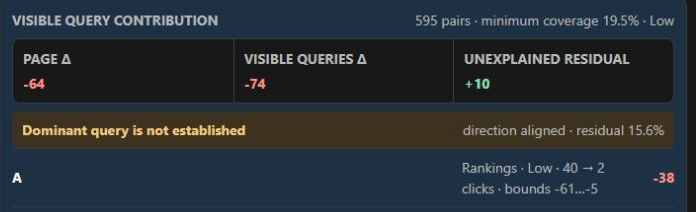
In GSC you can keep the page filter, open Queries and sort by the change in clicks. SEO Analyst does that comparison inside the page finding, ranks visible losses and checks how much of the page total the rows explain. Here are the three largest visible losses, checked against GSC.
| Query | Clicks | Change | Position |
|---|---|---|---|
| A | 40 → 2 | −38 | 8.7 → 10.4 |
| B | 17 → 1 | −16 | 8.1 → 9.5 |
| C | 11 → 1 | −10 | 9.4 → 11.7 |
105 → 41 clicks: what changed for queries A, B and C?
SEO Analyst compared 595 queries that Search Console reported for this page. We anonymized the three with the largest click losses as A, B and C. Together they brought 68 clicks in the first 28 days and 4 in the next 28.
- A. Clicks fell from 40 to 2 (−38) and average position slipped from 8.7 to 10.4. This query lost the most clicks.
- B. Clicks fell from 17 to 1 (−16). Average position moved from 8.1 to 9.5. Only one click remained even though the average position was still within the top ten.
- C. Clicks fell from 11 to 1 (−10). Average position dropped from 9.4 to 11.7. At 2.3 places, this was the largest ranking decline of the three.
Why check rankings first? SEO Analyst estimates the change in clicks from each factor. The largest negative estimate was for position (−130); fewer impressions contributed −89. The residual for CTR and query mix was +155. Together these estimates reconcile to the observed loss: −130 − 89 + 155 = −64. They are model estimates, so the next step is to test the ranking signal on an actual query.

B and C together lost 26 clicks. Adding the 38 lost on A gives 64, the same as the decline for the whole page. Other queries listed in GSC lost another 10 clicks on balance. The difference between the page total and the reported queries offsets those 10 clicks. The report does not identify which omitted queries account for that difference.
What to check next
In GSC compare the same periods and filter to each query in turn. For A and B, check how impressions and CTR changed alongside position. For C, which lost the most positions, remove the page filter and open Pages. Check whether another URL on your site gained impressions for C as the original URL lost them.
What SEO Analyst adds to Search Console
In GSC you can reproduce the comparison by filtering the page, sorting queries by the change in clicks and reconciling their sum with the page total. SEO Analyst does that work in the page report and estimates how much of the change is associated with rankings. Here it narrowed 595 queries to three priorities and showed how much of the change the available data covers. Investigate A first for lost traffic and C first for lost rankings. B is the second-largest click loss and belongs in the traffic review too.